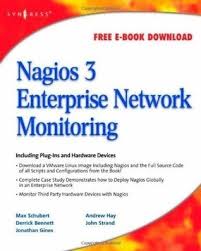
Nagios 3 is a powerful, open-source network monitoring solution designed to proactively identify and resolve potential IT issues. This white paper will delve into the intricacies of Nagios 3, exploring its core functionalities, advanced features, and best practices for effective network monitoring.Nagios 3 Enterprise Network Monitoring: A Comprehensive Guide.
Introduction
Nagios 3 is a powerful, open-source network monitoring solution designed to proactively identify and resolve potential IT issues. This white paper will delve into the intricacies of Nagios 3, exploring its core functionalities, advanced features, and best practices for effective network monitoring.
Core Functionalities
- Host Monitoring:
- Tracks the availability and performance of network devices (servers, routers, switches, etc.).
- Monitors critical services like HTTP, FTP, SMTP, and SNMP.
- Detects hardware failures, software errors, and network outages.
- Service Monitoring:
- Checks the status of specific services running on monitored hosts.
- Monitors service performance metrics like response time, throughput, and error rates.
- Triggers alerts for service failures or performance degradation.
- Event Logging and Notification:
- Records detailed logs of monitored events.
- Sends alerts via email, SMS, or other notification methods.
- Escalates alerts based on severity and predefined rules.
- Flexible Reporting:
- Generates customizable reports on system health, performance, and incident history.
- Provides graphical visualizations of key metrics.
- Helps identify trends and potential issues.
Advanced Features
- Remote Plugin Execution:
- Distributes the monitoring workload across multiple servers.
- Improves scalability and performance.
- Active and Passive Checks:
- Proactively checks the status of monitored resources.
- Reacts to events generated by monitored systems.
- Threshold Alerts:
- Defines thresholds for key metrics.
- Triggers alerts when thresholds are exceeded.
- Time Period Scheduling:
- Schedules checks to run at specific times or intervals.
- Optimizes resource utilization and reduces alert fatigue.
- Escalation Policies:
- Defines escalation procedures for different alert levels.
- Ensures timely resolution of critical issues.
- User Authentication and Authorization:
- Controls access to Nagios and its configuration.
- Enhances security and privacy.
Best Practices for Effective Network Monitoring
- Define Clear Monitoring Objectives:
- Identify critical systems and services.
- Determine key performance indicators (KPIs).
- Design a Comprehensive Monitoring Strategy:
- Create a detailed monitoring plan.
- Consider factors like network topology, service dependencies, and SLAs.
- Implement Robust Monitoring Configuration:
- Configure host and service checks.
- Define thresholds and escalation policies.
- Test the configuration thoroughly.
- Optimize Performance:
- Tune Nagios settings for optimal performance.
- Use remote plugin execution to distribute the workload.
- Establish Effective Alerting:
- Set up reliable notification channels.
- Prioritize alerts based on severity.
- Assign responsible teams for incident response.
- Regularly Review and Fine-Tune:
- Analyze monitoring data to identify trends and patterns.
- Update the monitoring configuration as needed.
- Conduct regular performance tuning.
References:
- Nagios Core Documentation:
- Nagios Exchange: https://www.nagios.org/documentation/
- Various online forums and communities (e.g., Nagios Forums, Reddit)
Conclusion
Nagios 3 is a powerful tool for proactive network monitoring. By following best practices and leveraging its advanced features, organizations can significantly improve their IT infrastructure's reliability, performance, and security. Contact keencomputer.com
